How Uplifting it Can Be
By Sam Koslowsky, Senior Analytic Consultant, Harte Hanks
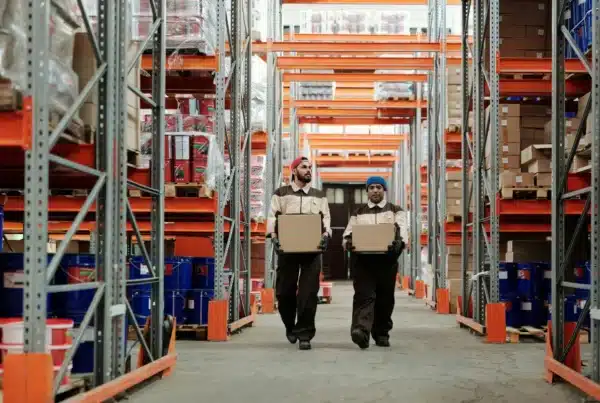
Yes, I admit it. A free shipping offer often catches my eye. But I’m not the only one. “Free shipping is slowly, but surely becoming one of the most powerful weapons in ecommerce’s decisive battle for consumers. No matter how you look at it, people love getting something for free, even if it’s shipping. “ 1 And it is obvious – you want to pay for the item, only, not for anything else.
Make no mistake. Companies provide free shipping primarily for marketing but also to nurture and expand their customer base.
With this in mind, why don’t all marketers provide a free shipping offer? Forbes reports that a majority of consumers have discarded their shopping carts as a result of unacceptable shipping options. Many consumers cite free shipping as the primary reason for purchasing. 2
Wow! Sounds like a no-brainer. Let’s give the customer what she wants. But wait a minute. Not everyone is alike, and many may not require this freebie. They would be just as pleased adding the shipping cost to their cart. But who are these consumers? Wouldn’t it be insightful to identify them? And, similarly, would it not be perceptive to recognize those in your market that require the free shipping option to complete their purchase? This intelligence would certainly help optimize your bottom line! So how do we proceed?
Enter uplift modeling. Let’s spend a moment discussing this approach, and then we’ll get into an example displaying the benefits of this tool.
Typically, marketers decide on a response model that would assist management in determining who is likely to purchase. And the model does a good job at doing this. Others might use this tool to provide guidance on how to select customers that require an incentive to purchase, and thus generate incremental profit. While occasionally response algorithms can provide some direction in this regard, many times it cannot. Let’s do the math. You can follow along below.
We are dealing with two groups that were mailed- a treated segment-one that received a free shipping offer, and an untreated segment, a control group, where no incentive was offered.
The analysis below is based on examining the best segment form the response model-the first decile, only. Ten thousand customers reside in this top performing group.
Using a response model
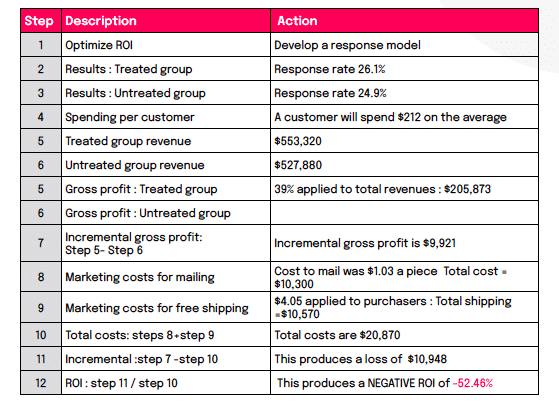
As the above analysis highlights, the response model did not produce the desired returns-indeed a negative ROI results.
We will return later once more after we learn a bit more about uplift modeling, and perform the identical financial analysis.
Uplift modeling expands on this response model technology by providing additional insight. Did the free shipping offer cause the customer to buy the product? Would the customers that did indeed purchase with the free shipping offer, have purchased in any case, even without the offer. And finally, were any of my customers turned off by the offer. They did not purchase. But they would have, if the free shipping offer was not presented.
So as a strategic initiative, which would you rather pursue? -the response model that predicts future purchasers, or the uplift analysis which provides the influence of providing the free-shipping option.
My purpose here is not to investigate the variety of approaches that are currently being employed to make this analysis work. Rather, I want to demonstrate the application of this technique on a well appreciated marketing offer-free shipping.
Without getting into the details, the approach used in the current analysis relies on recursive partitioning
Decision trees are formulated that present the sequence of rules that must be employed to obtain a prediction.
This technique creates prediction rules by repeatedly dividing the sample into subgroups, with each segment being formed by separating the sample on the value of one of the predictor variables. The end result is a set of branches that forms a treelike structure in which each final branch provides a yes/no prediction of the outcome. In the case of uplift-modeling, each branch identifies the difference in ‘response’ rate between a treated group-those receiving a marketing offer, vs. a control group (untreated)-those that did not receive the offer.
Let me now present the initial results of an uplift model that was designed to evaluate the incremental response that emerged from a free shipping offer program. All numbers have been modified from the original data so that results can be clearly understood. The solution presented, while exaggerated in terms of uplift, nevertheless corresponds with actual results. Variables displayed in the trees are actual predictors employed in constructing the model.
Historical transaction related, and associated demographic data were collected for a sample of customers. Approximately 60% of the mailed file were offered the free-shipping offer. Let’s slowly construct the ‘TREE’ that will help define the uplift in response rate.
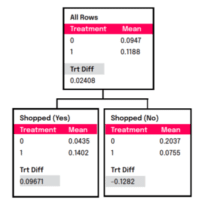
In the upper box-the ‘root’ of the tree, we find that those that received the offer (‘1’ under treatment heading) responded at an 11.88% response rate, while those that were untreated (the control group) responded at 9.47% pace. Thus the overall difference in response rate was 2.408%-all depicted in the root node. The question now is, “how do we find subsegments where the variance in response rates between treated and untreated groups is at a maximum”?
Our tree proceeds to determine that those that shopped within the past year (‘shopped(yes)’) and were in the treatment group produced a 14.02% response rate. The non-treated counterpart generated a 4.35%., resulting in a uplift of 9.671%!
Peering over those that that did not shop in the past year (‘shopped(no)’), we observe an interesting phenomenon-the control group outperformed the treated group by 12.82%. This is what I refer to as being “turned off” by receiving the free shipping offer. Let’s now continue, and grow the tree.
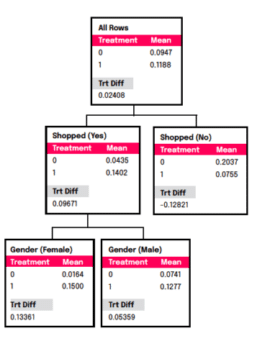
Here we notice that gender has now emerged as an additional predictor. Females that have shopped in the past 12 months generated a 13.361% incremental response, while males produced just a 5.359% rate.
We now proceed to the next layer.
Income (newincome) has now surfaced as an additional predictor. Those shopping in the past 12 months, that are female and whose income exceeds $66,528 deliver an uplift of close to 19%! It’s pretty impressive.
The segments defined above may be quite small, and indeed some of them are. It is , admittedly difficult, locating large segment that can display ‘large’ incremental rates.
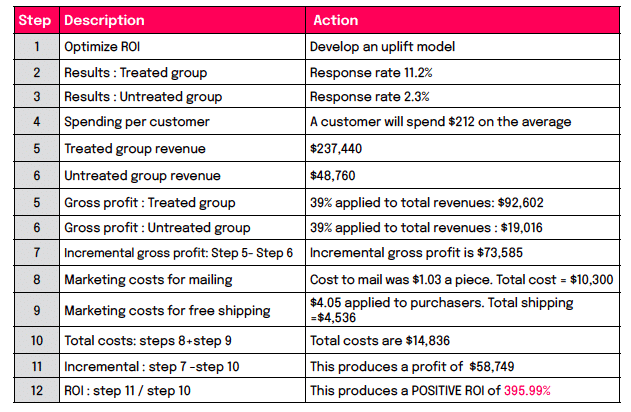
While many more branches were appended, I hope you can see the picture , both visually and analytically. Let’s return to our financial analysis. But this time, we employ the uplift model.
By again focusing on decile 1, our numbers change quite a bit! Gross profit of $73,585 is associated with $14,836 of costs, resulting in an ROI of nearly 400%.
Now, don’t expect these sorts of returns at every point. Sometimes the data does not support identifying meaningful ‘uplift’, or the difference between treated and untreated groups is minimal. But it often does suggest where you should be allocating advertising dollars.
You may very well have heard about the successful retail tycoon, John Wanamaker (1838-1922). A marketing innovator, he once concluded, “Half the money I spend on advertising is wasted; the trouble is I don’t know which half”. With uplift modeling, you have a good chance to pinpoint which half is working and which half isn’t — or more directly, what customers are most influenced by advertising and which customers aren’t.
I hope you get the idea. By engaging in uplift analyses, the marketer has a further opportunity to convert a ‘free shipping’ offer to a more optimal one. How ‘uplifting’ this can be! By again focusing on decile 1, our numbers change quite a bit! Gross profit of $73,585 is associated with $14,836 of costs, resulting in an ROI of nearly 400%.
1 http://savemycent.com/free-shipping-statistics/
2 https://www.forbes.com/sites/forbestechcouncil/2019/08/27/shipping-is-critical-to-keeping-online-shoppers-happy/?sh=dd3767c178cb

Sam Koslowsky serves as Senior Analytic Consultant for Harte Hanks. Sam’s responsibilities include developing quantitative and analytic solutions for a wide variety of firms. Sam is a frequent speaker at industry conferences, a contributor to many analytic related publications, and has taught at Columbia and New York Universities. He has an undergraduate degree in mathematics, an MBA in finance from New York University, and has completed post-graduate work in statistics and operations research.